
Plant science,
in more dimensions.

Specialist imaging. Richer plant geometry. A closer connection between what you capture and what you can learn.

We’re building Pro for research teams who need to go further with their plants.

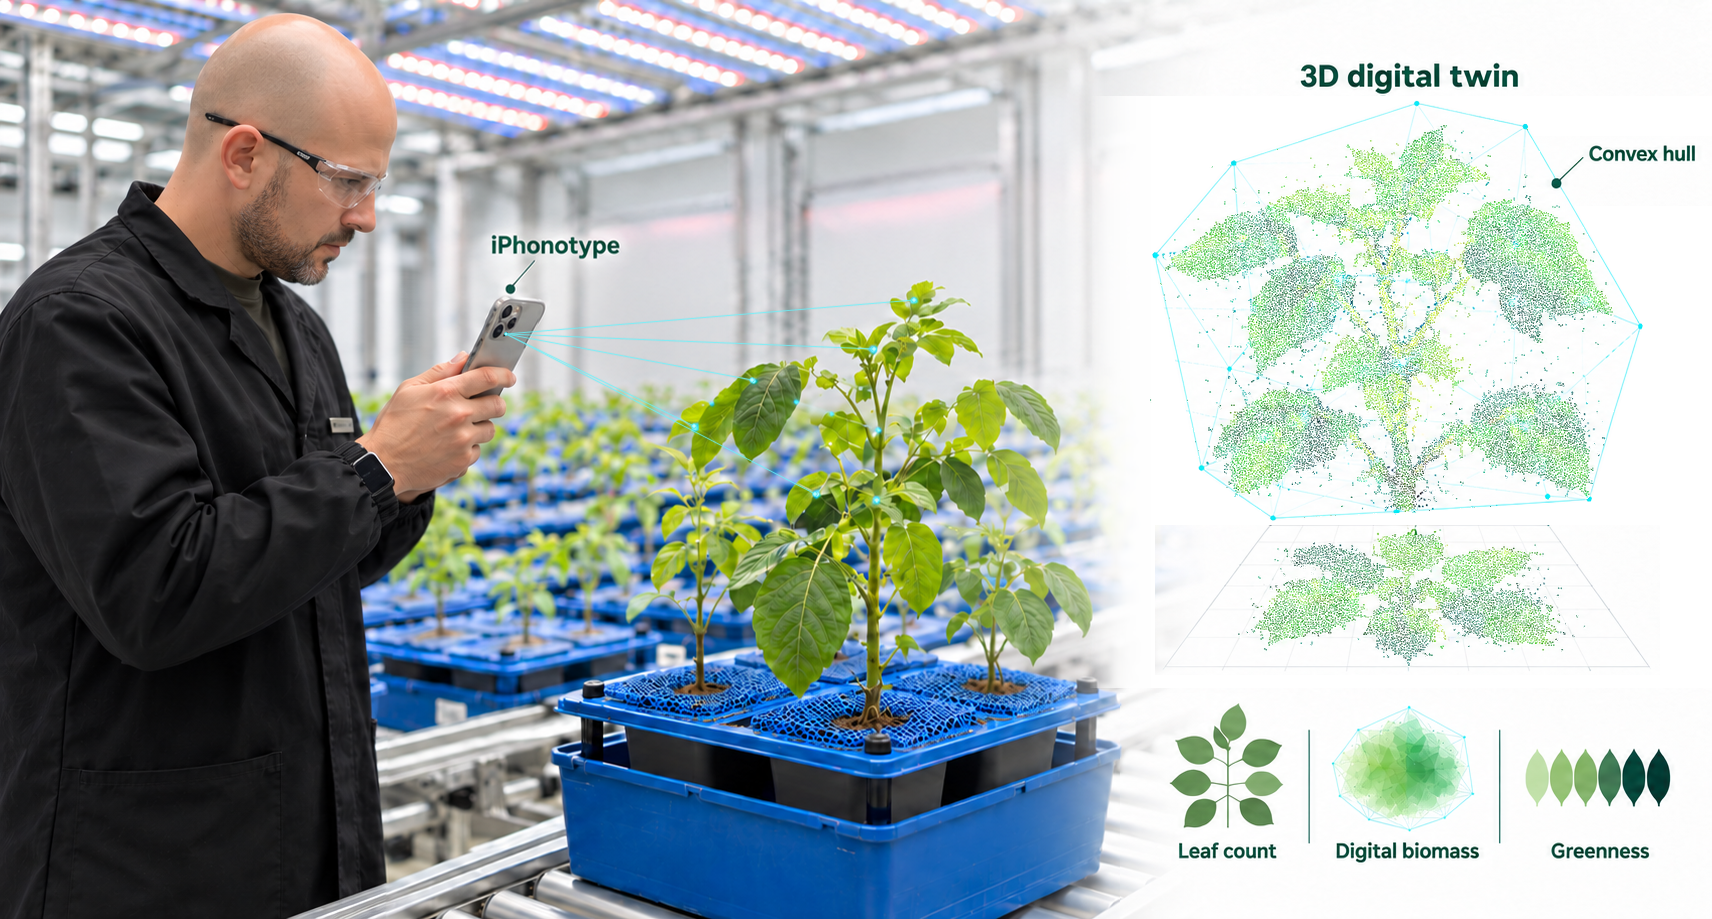
A researcher wearing clear safety goggles scanning living plants beside an illustrative 3D plant digital twin.
The Pro vision, illustrated.Recorded demonstrations below.

Beyond the visible surface

A new view of
the same plant.

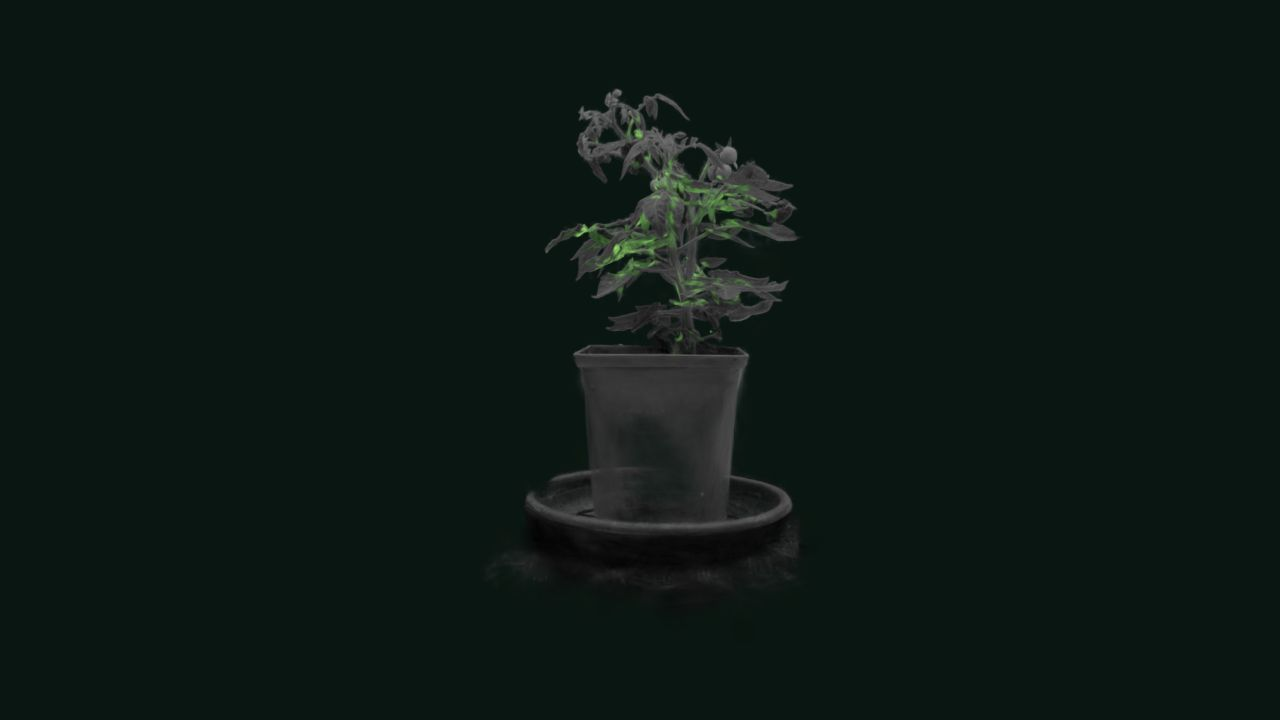
Bring specialist sensor observations into the plant’s spatial context. Explore our recorded thermal and fluorescence demonstrations, directly in your browser.

Recorded coffee plantsGaussian splats · Recorded FLIR samples

Temperature, located on the plant.

Follow the coffee leaves and their recorded thermal samples. Pause to turn the plant, select a leaf region and inspect its temperature summary, then resume the guided tour.

Recorded samples · selectable leaf regions

Each regional summary uses the recorded samples it contains. Coverage and calibration matter; unobserved surfaces have no assigned temperature.

Open the full viewer

Specialist imaging uses additional sensors and a defined acquisition protocol. These demonstrations introduce the workflow; measurement validation is specific to each project.

Advanced plant geometry

The whole plant.
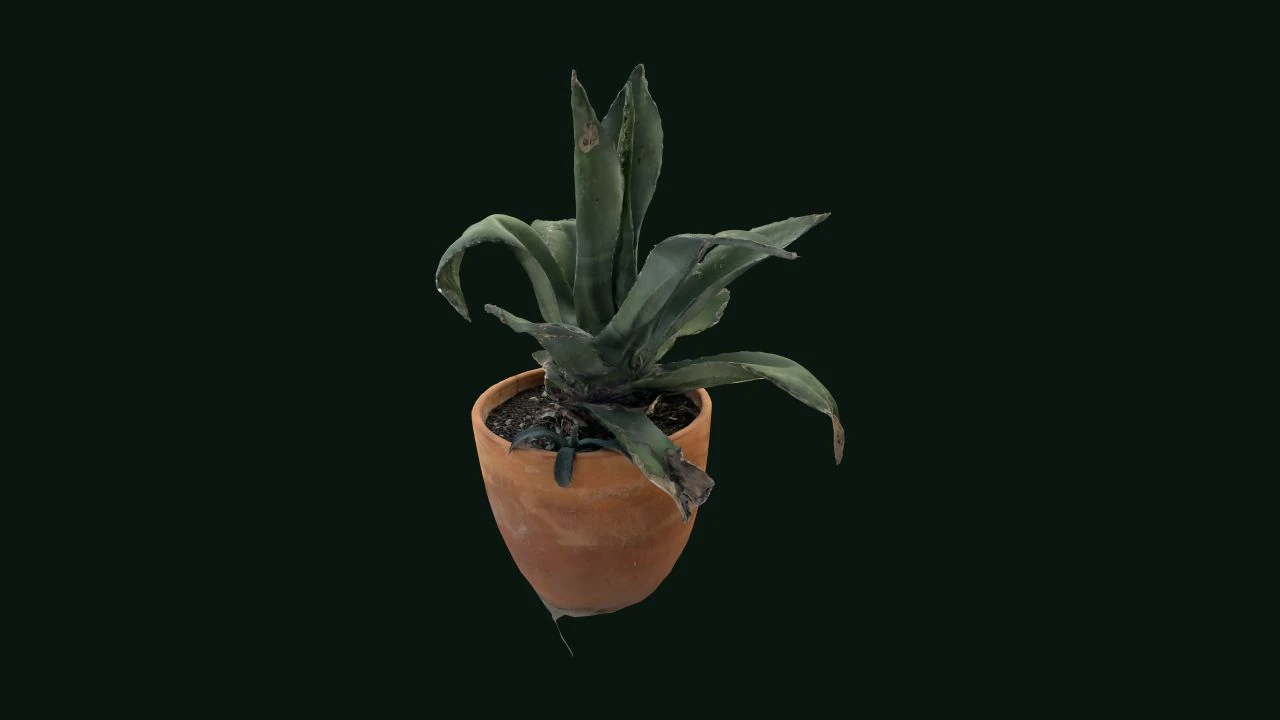
The individual leaf.

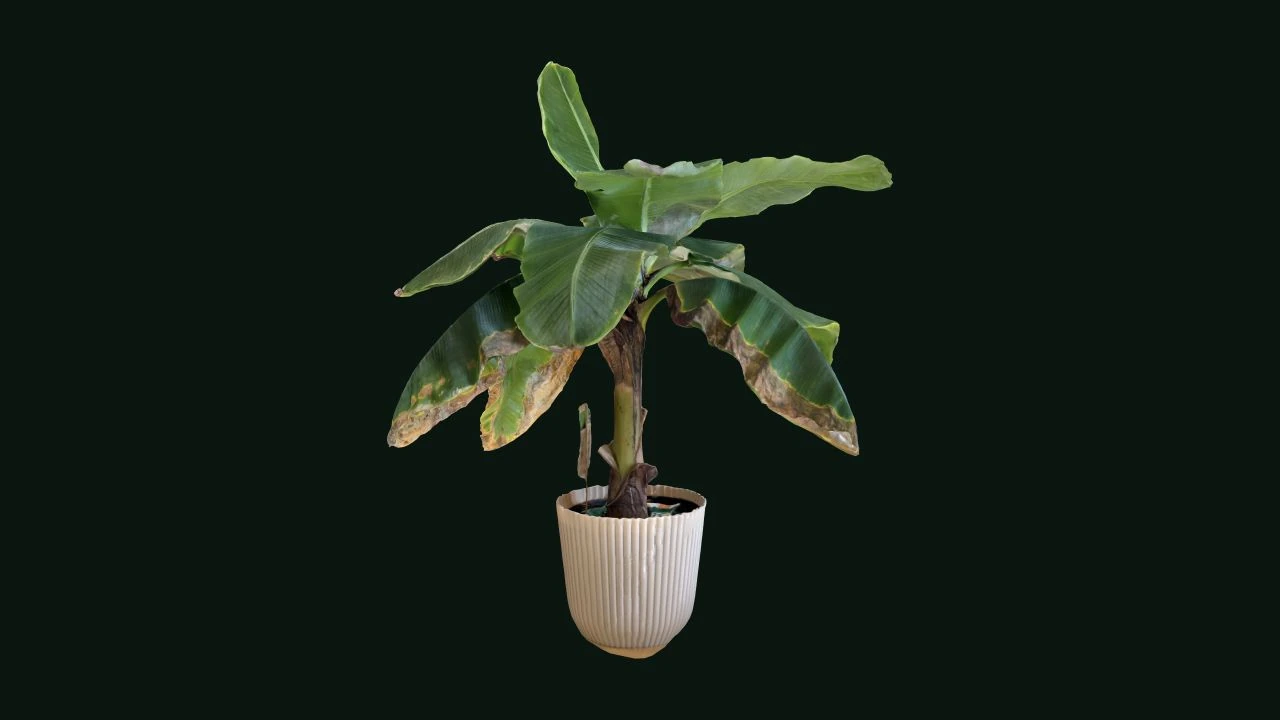
Explore banana and Agave captures in 3D. The guided tour moves through each plant’s views, or you can pause and explore.

Choose a plant

The captured banana plant reconstructed in 3D.
A real banana plant captureA guided tour · pause or explore any time

Height above reference

See the plant’s reconstructed height above the capture’s reference plane.

Canopy spread

Explore the widest horizontal span of the captured canopy and its perpendicular span.

Canopy envelope

Inspect the outer 3D boundary, including the open space between leaves.

Measured geometry depends on the capture, scale and trait definition.Open the full banana viewer

Custom pipelines · Potato time series

Growth, in place.

The same plants, captured where they grow. Explore their recorded structure across three dates, then look closer at the measurements and source evidence.

24 potato plants6 trays3 observed dates7–13 October 2026

Real Gaussian captures. A consistent scale across dates.

Explore plants & evidence
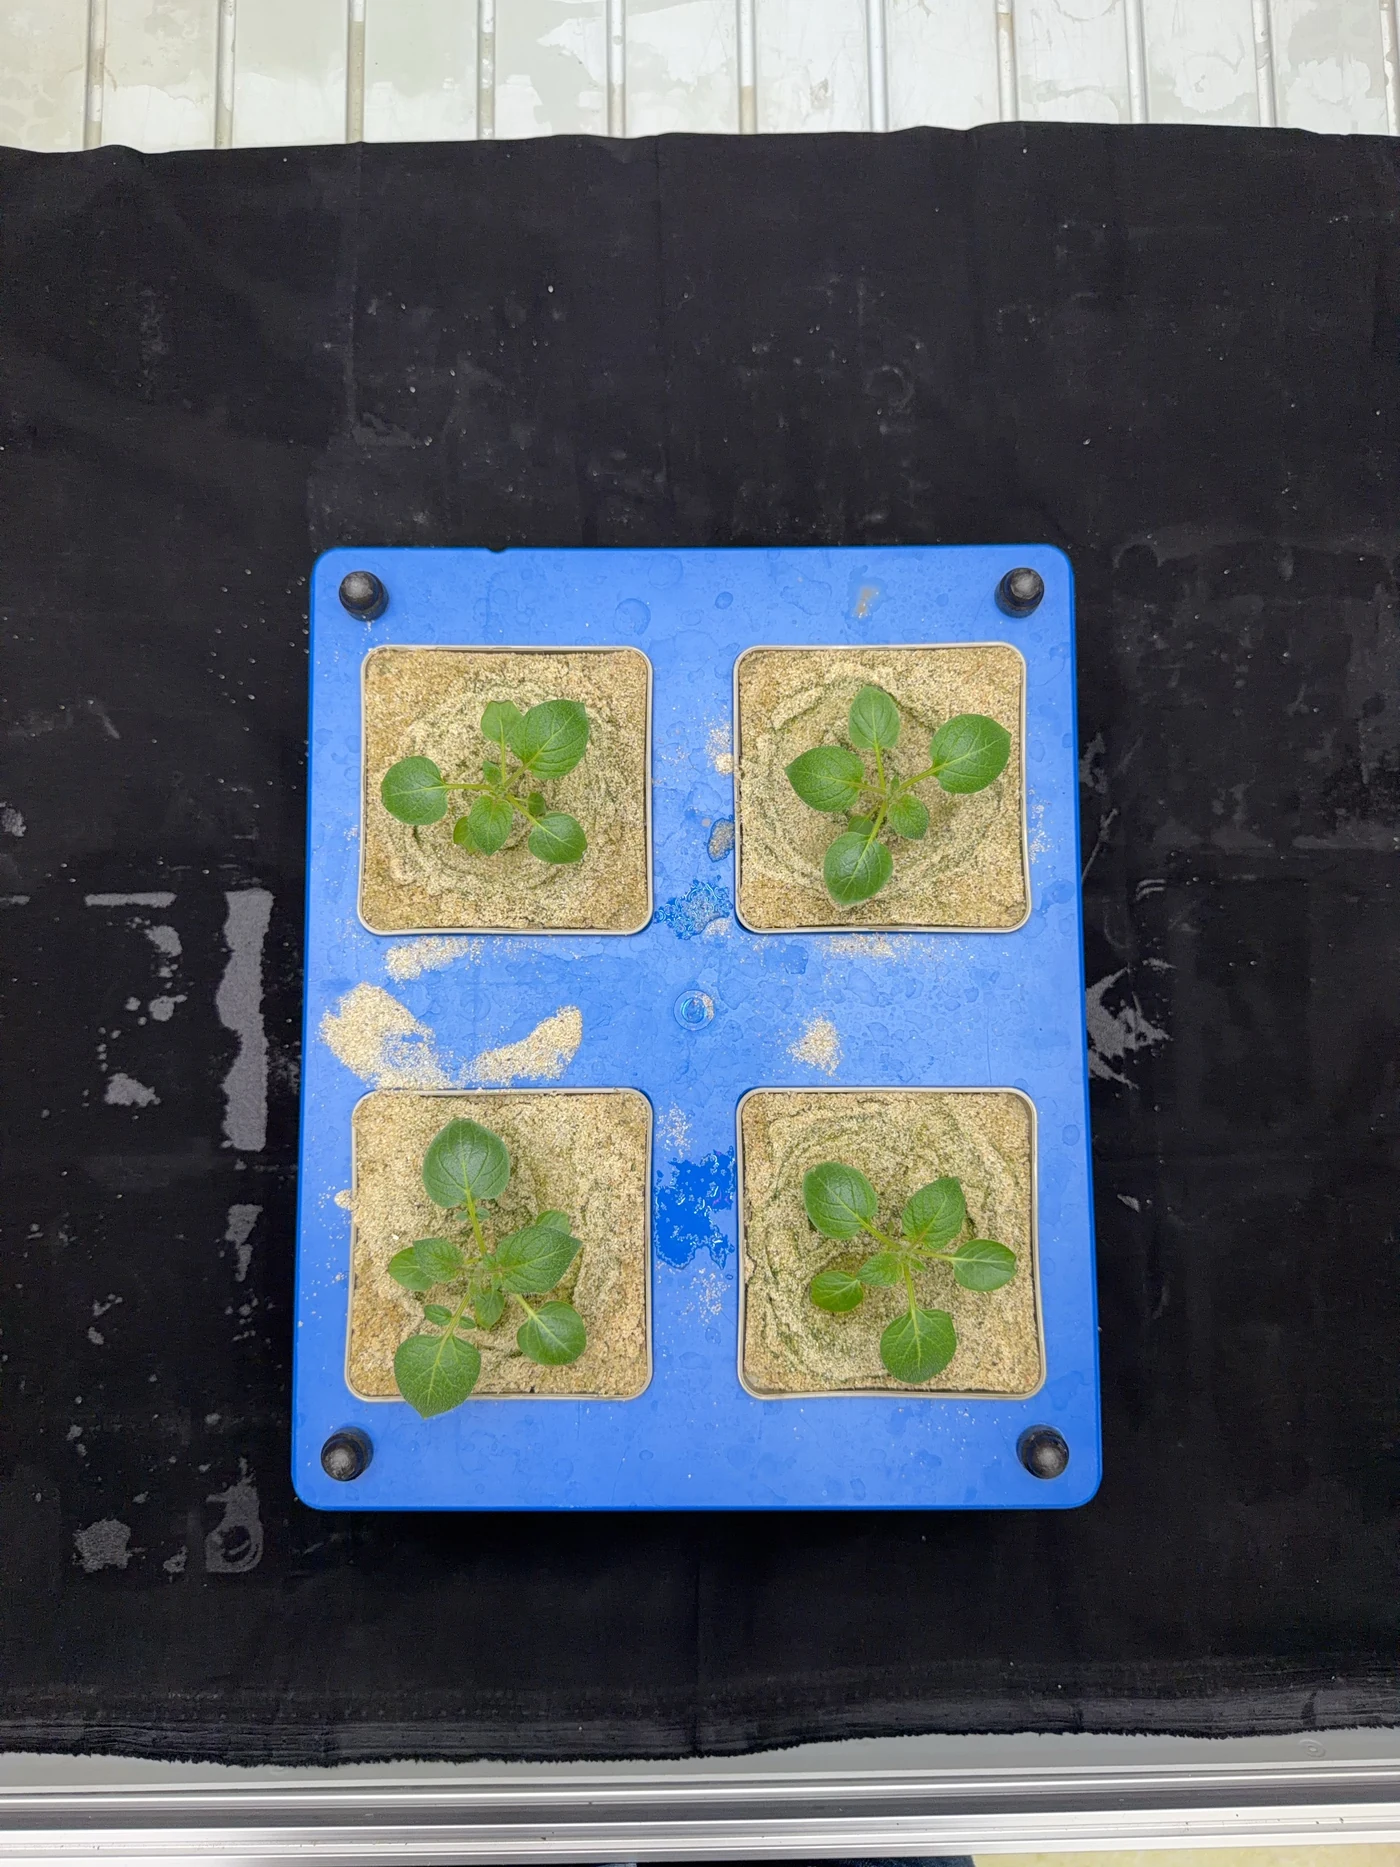
Top-down photograph of tray 2169, framed around the complete blue tray and all four potato plants.
Top view · all four plants · tray 2169 · 13 October

Capture once. Keep asking.

More from
the same scans.

Photogrammetry grounds the scale. Gaussian splats preserve the observed appearance. SAM2.1 adds inspectable blade proposals.

Hover over the tray to reveal the analysis.

High- and low-light chambers are shown descriptively: one chamber per regime. Blade estimates are provisional.

Interactive field capture labs

Walk the crop.
Reveal the canopy.

Explore a strawberry greenhouse and an open potato field. Follow the virtual phone pass, switch between capture layers and discover what each workflow can reveal.

A virtual pass through the crop

Enter the greenhouse.
Explore the exposed fruit.

Strawberry row capture

Walk the hanging rows, explore RGB, depth, surface and fruit views, then review visible fruit counts, colour stages and illustrative size distributions.

Synthetic scene · interactive workflow demonstration

Simulated geometry and observations explain the workflow. They are not field measurements or validated model results.

Open the full greenhouse

Moss surface analysis

Moss, beyond
the photograph.

Compare textured photogrammetry and Gaussian splats, then explore canopy relief and local roughness. Follow the guided tour or pause to explore.

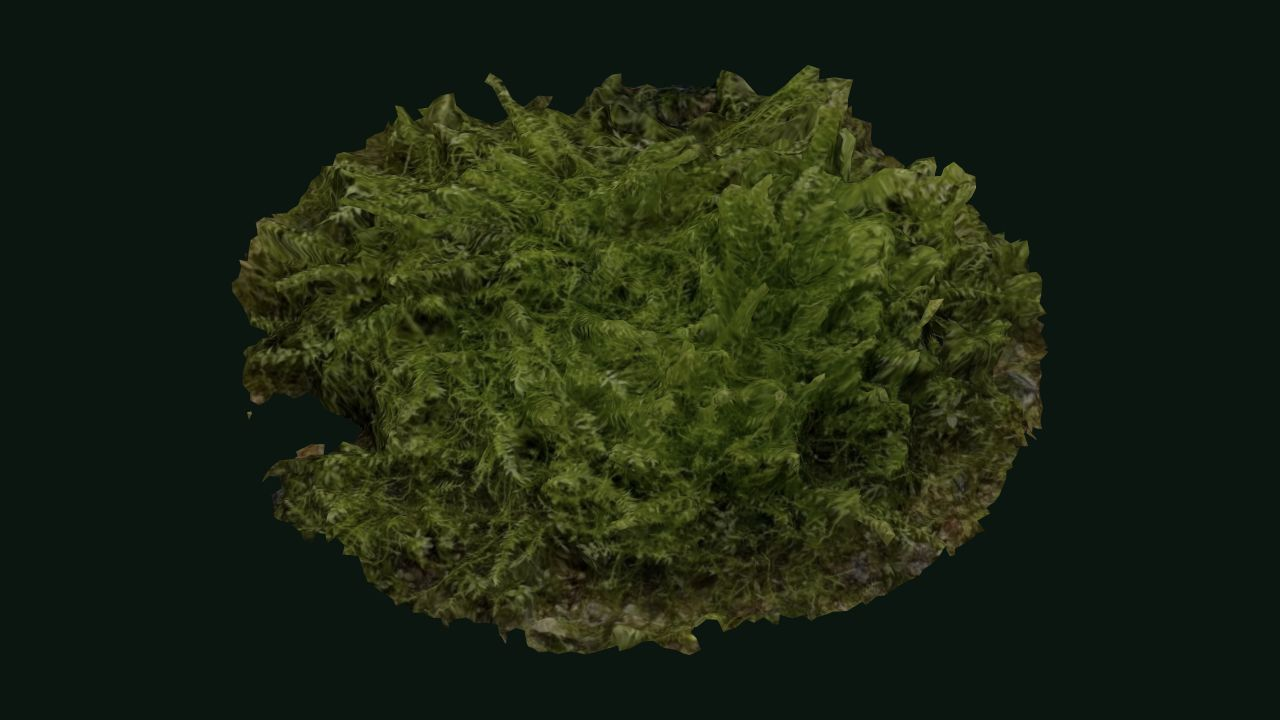
The recorded moss surface reconstructed in 3D.
Recorded moss capturesA guided tour · pause or explore any time

See the structure of the surface.

Move between photogrammetry, Gaussian splats and the surface analysis views. Spatial Orbit and Front Macro show two recorded capture approaches.

Moss surface reconstructions · guided 3D views

Gaussian splats show the recorded appearance. Surface measurements use the photogrammetry models and their recorded reference scale; sampling support describes the reconstruction, rather than biological moss cover.

Open the moss viewer

iAero · Janskerkhof, Utrecht

Explore the square.
Inspect the trees.

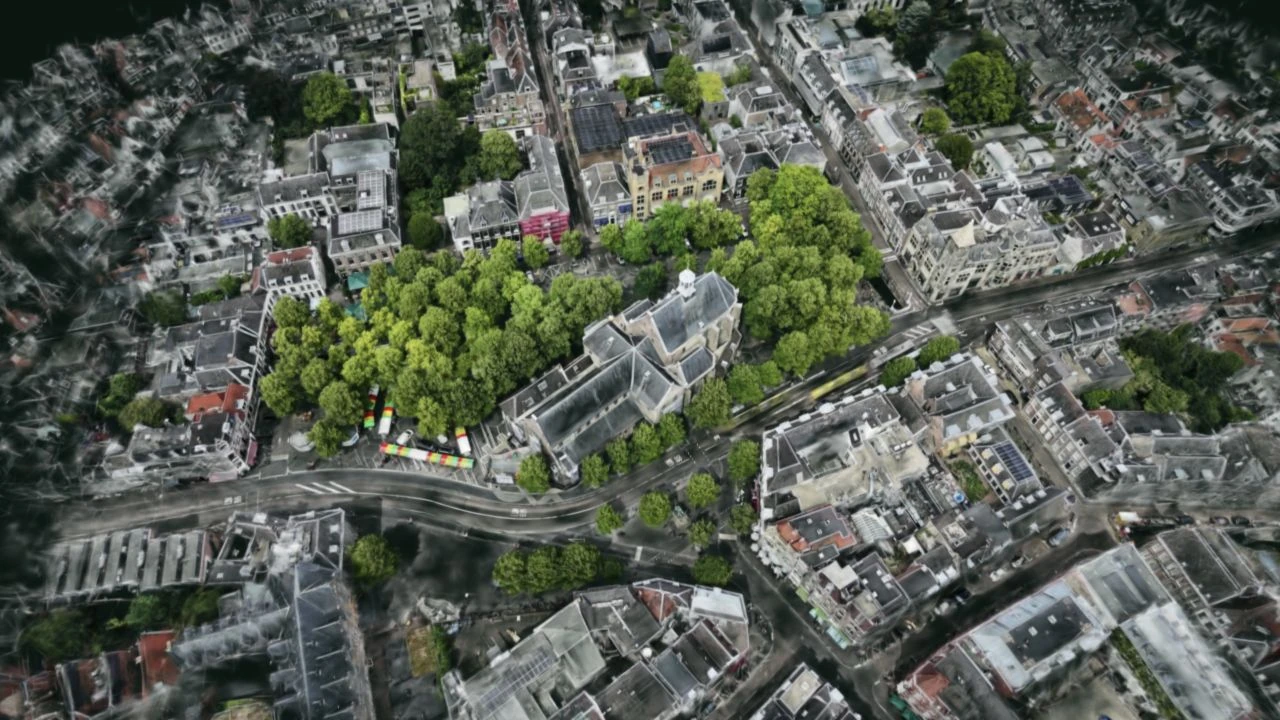
Select a tree crown to see its estimated height, crown dimensions and footprint. Choose Move view to explore another part of the square, then return to Select trees to inspect a crown.

The Janskerkhof square reconstructed from aerial captures, with tree crowns visible in the scene.
Janskerkhof · iAeroSelect trees to inspect · Move view to navigate
Reconstructed crown estimates · telemetry-based scale · independent survey validation remains open.Open the iAero viewer
Ghana orchid collection · six real captures

Captured where they grow

Closer to the flower.

Complex flowers, stems and leaves, captured in their growing environment. Explore six orchid reconstructions, with source-linked flower observations and scale where supported.

Explore the Ghana orchid collection


Built for a research question

Results you
can inspect.

About these demonstrations

Start with the trait.

Define what the measurement means, which plant region it describes and what level of uncertainty your study can accept.

Connect the sensor to the surface.

Keep the source observations, reference scale and alignment visible. Thermal and fluorescence need their own hardware and acquisition conditions.

Validate for the experiment.

Use reference measurements and repeated captures to establish performance for your plants, your environment and your protocol.

The next step for iPhonotype

Build the Pro workflow
your research needs.

Tell us about your crop, the traits you need and where you work. Together, we can scope a pilot around the right sensors, capture protocol and validation.

Discuss a Pro pilot

iPhonotype Pro is in development. Demonstrations show current research workflows; scope and validation are agreed per project.

People & collaboration

The team behind Pro.

We acknowledge NPEC for its contribution in providing the grounding test for all the techniques that we showed here.

Acknowledgements

iPhonotype Pro

The Pro film · 2 minutes